CEEMS API Server
Background
The CEEMS exporter exports compute unit and node-level metrics to Prometheus. However, this is not enough to be able to query the metrics from Prometheus efficiently. Especially, for batch jobs, we need at least the timestamps of when the job has started and ended and on which compute nodes to efficiently query the metrics. Storing these metadata of the compute units in Prometheus is not ideal as they are not time series, and using storing metadata as labels can increase the cardinality very rapidly.
At the same time, we would like to show end users aggregated metrics of their usage which needs to make queries to Prometheus every time they load their dashboards. The CEEMS API server has been introduced into the stack to address these limitations. The CEEMS API server is meant to store and serve compute unit metadata, aggregate metrics of compute units, users, and projects via API endpoints. This data will be gathered from the underlying resource manager and kept in a local DB based on SQLite.
SQLite was chosen for its simplicity and to reduce dependencies. There is no need for concurrent write access to the DB as compute unit data is updated frequently by only one process.
Effectively, it acts as an abstraction layer for different resource managers and is capable of storing data from different resource managers. The advantage of this approach is that it acts as a single point of data collection for different resource managers of a data center, and users will be able to consult their compute unit usage in a unified way.
If usernames are identical across different resource managers (i.e., if a data center has SLURM and OpenStack clusters with user identities provided by the same Identity Provider (IDP)), operators can use a single CEEMS deployment with the same IDP. This allows exposing compute unit metrics from both SLURM and OpenStack clusters through the same Grafana instance with different dashboards.
Objectives
The CEEMS API server primarily serves two objectives:
- To store the compute unit information of different resource managers in a unified way. The information we need is very basic, such as the unique identifier of the compute unit, the project it belongs to, the owner, current state, when it has started, resources allocated, etc.
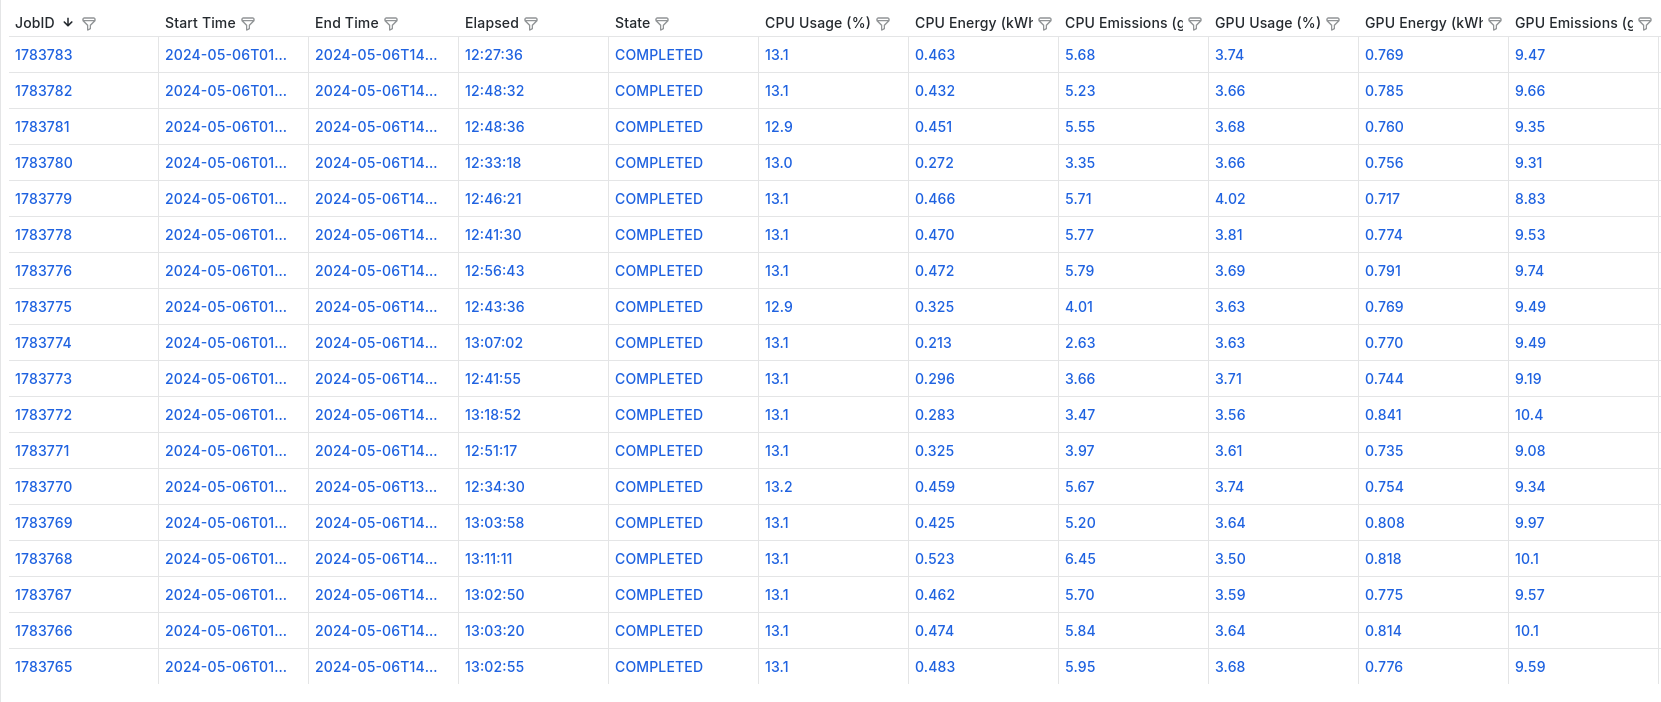
- To update aggregated metrics of each compute unit by querying the TSDB in real time. This allows end users to view the usage of their workloads in real time like CPU, energy, emissions, etc.
- To keep the latest copy of users and their associated projects to enforce access control.
When coupled with the JSON API DataSource or Infinity DataSource of Grafana, we can list a user's compute units along with the metadata and aggregated metrics of each unit. The stored metadata in the CEEMS API server's DB will allow us to dynamically construct the URLs for the Grafana dashboards for each compute unit based on its start and end time.

Architecture
Resource Managers
Now that it is clear that CEEMS can support different resource managers, it is time
to explain how CEEMS actually supports them. CEEMS has its own DB schema that stores
compute unit metrics and metadata. Let's take metadata of each compute unit as an
example. For example, SLURM exposes metadata of jobs using either the sacct command or
SLURM REST API. OpenStack also provides this through Keystone and Nova API servers, as does
Kubernetes through its API server. However, all these managers expose these metadata
in different ways, each having their own API spec.
The CEEMS API server must take into account each resource manager to fetch compute unit metadata and store it in the CEEMS API server's DB. This is done using the factory design pattern and is implemented in an extensible way. That means operators can implement their own third-party resource managers and plug them into the CEEMS API server. Essentially, this translates to implementing two interfaces, one for fetching compute units and one for fetching users and projects/namespaces/tenants data from the underlying resource manager.
Currently, the CEEMS API server includes SLURM support, and soon OpenStack support will be added.
Updaters
As the CEEMS API server must store aggregated metrics of each compute unit, it must query some sort of external DB that stores time series metrics of the compute units to estimate aggregated metrics. As CEEMS ships an exporter that is capable of exporting metrics to a Prometheus TSDB, a straightforward approach is to deploy the CEEMS exporter on compute nodes and query Prometheus to estimate aggregated metrics.
This is done using a sub-component of the CEEMS API server called the updater. The updater's role is to update the compute units fetched by a given resource manager with their aggregated metrics. Like in the case of the resource manager, the updater uses the factory design pattern and it is extensible. It is possible to use custom third-party tools to update the compute units with aggregated metrics.
Currently, the CEEMS API server ships a TSDB updater that is capable of estimating aggregate metrics using the Prometheus TSDB server.
Multi-Cluster Support
A single CEEMS API server deployment must be able to fetch and serve aggregated metrics from multiple clusters, whether they use the same or different resource manager. This means a single CEEMS API server can store and serve metrics data of multiple SLURM, OpenStack, and Kubernetes clusters.
Similarly, whether each cluster uses its own dedicated TSDB or a shared TSDB with other clusters, the updater subcomponent of the CEEMS API server is capable of estimating aggregated metrics for each compute unit.
More details on how to configure multi-clusters can be found in the Configuration section, and some example scenarios are discussed in the Advanced section.